Table of Contents
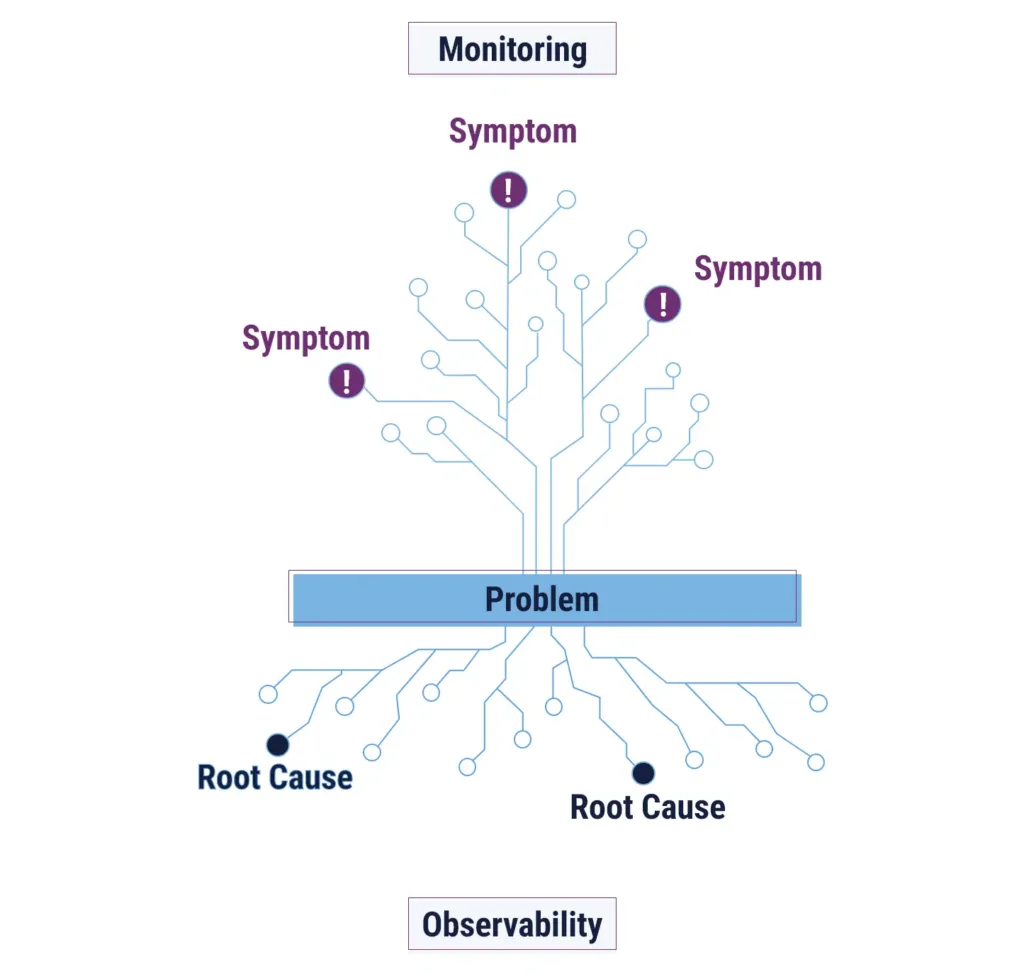
Do you experience a repeat problem in your life? Maybe it’s losing track of your keys or forgetting the lunch you packed in the fridge before you head to the office. Noticing you are experiencing a problem and identifying the root cause of the issue are two different things. This, in essence, is the difference between observability and monitoring.
We’ll explain how monitoring is a lot like noticing you left your lunch at home three days this week, and observability is noticing that it keeps happening because you don’t have a noticeable reminder to grab your lunch. We’ll also talk about why you need both, and what you should consider when evaluating tools.
What is Observability vs. Monitoring?
Monitoring can tell you whether a system is working, while observability can help IT teams understand why a system isn’t working. In short, monitoring finds deviations from the expected, and observability diagnoses the unexpected.
What is Observability?

Observability helps businesses surface patterns and trends in a cloud environment, as well as understand a system’s internal state. It leverages context, including historical and situational data across cloud environments, to provide deep insight into system performance and health. Effective observability also requires systems that are instrumented to generate rich, contextual telemetry using metadata, relationships between components, and event correlation across layers.
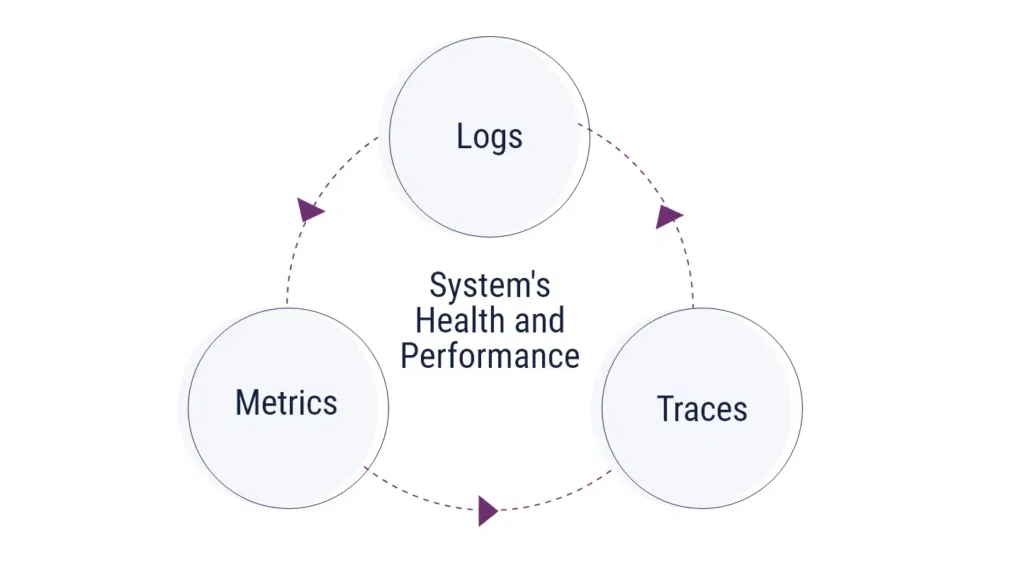
There are three pillars of observability:
- Traces: Helps teams understand the flow of execution in a distributed system. Observability tools (traces) will create records of when different components interact in a system.
- Logs: Records that track events and can help organizations understand behaviors in a system over time. They can help teams find errors or anomalies and understand the sequences of events that led up to them.
- Metrics: Measures the performance of a system. These serve as aggregates of data points over time and can describe things like error rates, latency, CPU utilization, and more. By looking at metrics, organizations can improve performance by finding obstructions in the system.
What is Monitoring?
Monitoring focuses on the current state of a system, primarily by using pre-configured reports, alerts, and dashboards to track performance metrics. This helps teams pinpoint problems in the system, whether they conduct a manual process or automate reports regularly, after a specific event occurs, or when a threshold is hit.
Many modern monitoring tools now incorporate logs and traces. However, they lack the advanced correlation, context, and exploration capabilities that define true observability.
Key Differences Between Observability vs Monitoring
While they help each other, observability and monitoring are two separate concepts. Here are some of the key features that will help you understand the differences between them:
| Feature | Observability | Monitoring |
| Goal | Understand why something is behaving abnormally in a system or not working | Understand whether something in the system is behaving abnormally or not working |
| When to Use | Proactively to prevent issues and reactively when problems arise for diagnosis | Reactively to understand what problem has just occurred |
| Data Types | Metrics, logs, and traces | Mostly metrics – error rates, CPU, memory, etc. |
| Use Cases | ||
| Relationship | An extension of monitoring that can help understand deeper causes of current problems or anticipate future issues | A component of observability that focuses on solving current problems |
Why You Need Both Observability and Monitoring

Observability and monitoring can’t be done in isolation if you want to effectively solve problems your organization faces. That’s why you need both.
When you use observability and monitoring together, you will be able to:
- Detect and resolve issues: By monitoring infrastructure and applications in real time, observability and monitoring tools can quickly detect issues and alert IT teams to take action. This can help minimize downtime and prevent performance issues from impacting end-users.
- Improve system performance: Monitoring tools can provide insights into how systems are performing, which can help IT teams optimize infrastructure and applications to proactively improve performance and reliability.
- Enhance security: These practices can help identify cyber threats, such as unauthorized access attempts or cloud malware, enabling IT teams to take quick action to mitigate risks and protect sensitive data.
- Ensure compliance: Many organizations have regulatory compliance requirements that mandate monitoring and reporting of IT infrastructure and applications. Both types of tools can help meet these demands.
Observability and monitoring are also both fundamental to successful DevOps and site reliability engineering (SRE) practices. DevOps emphasizes collaboration and efficient, iterative development. Observability can speed up the debugging process, enabling continuous improvement and quick identification and solving of bottlenecks in code. Monitoring can help SRE teams create and track service level indicators (SLIs) and service level objectives (SLOs), which can help them manage their error budgets more effectively.
All in all, prioritizing observability and monitoring across your IT environment can equip your organization with the knowledge and confidence to improve your infrastructure management.
What Does Observability vs. Monitoring Tooling Look Like Today?
Observability and monitoring tools are now often packaged together. Datadog, Splunk, and New Relic are examples of combined platforms that bring metrics, logs, and traces together into a unified view of your entire technology stack. Having integrated observability platforms versus traditional monitoring tools is important when you’re trying to understand the root cause of an issue, because you can correlate data that may come from different sources.
These tools frequently come with automation as well, reducing the effort involved in data collection or alerting customers to anomalies. They are also frequently designed with cloud-native compatibility in mind, integrating with major cloud providers and container orchestration platforms.
Open-source observability tools are also currently big in this space. Organizations that are looking for more control over their tools can take advantage of these tools to create a custom observability stack, which might include OpenTelemetry, Prometheus, Grafana, Loki, or Jaeger, among other resources.
Artificial intelligence and machine learning (AI/ML) also play a prominent role in observability and monitoring. These technologies can take raw data and turn it into actionable insights, helping organizations detect anomalies, analyze root causes, and recognize patterns in logs more quickly. AI/ML resources can reduce noise and improve the ability to forecast potential problems before they may ever be noticed by a human observer.
What to Evaluate When Choosing Tools
How do you know which tools are right for you? By evaluating your current needs, established infrastructure, and long-term goals, you can make appropriate choices.
When choosing and implementing these tools, you’ll also want to be mindful of common pitfalls, which can include:
- Tool spread: Having too many tools can hamper visibility and increase your expenses.
- Alert fatigue: This happens when your team receives too many false alarms, reducing the likelihood that they will act quickly when a critical alert comes in.
- Lack of actionable insights: Conversely, having too few insights can mean the tools are not sensitive enough, and they’re not identifying patterns or anomalies that should give rise to alerts.
Consider the following factors when choosing tools:
Integration with Existing Stack
Does the tool integrate well with your existing tech stack, or will it take considerable work to connect the data? How hard will it be to send data from the applications and infrastructure to the tool? Is it possible that the tool can consolidate the data from existing solutions, reducing tool sprawl?
Multi-Cloud/Hybrid Compatibility
If you have an environment that includes multiple clouds or a combination of public and private cloud environments, the tool should be able to provide consistent functionality and visibility across all environments. You may also want to see if the tool offers integrations with major cloud providers or, if necessary, support for on-premises infrastructure.
Customizability and Dashboards
Different teams will have different metrics they want to see on a dashboard, so being able to customize to various teams or business goals can be important. You may also want to think about how querying works in tools, how specific you can get with alerts, and what reporting features are available. For example, if you want to track compliance or easily see trends, these should be features you seek out in tools.
Cost and Scalability
What does the pricing model look like for each tool? Some tools may charge by the amount of data being ingested, the number of active users, or the number of hosts. Understanding how the tools are priced and how they might change if they scale will help you decide whether they will work with your budget in the short- or long-term. If you need to retain data, find out how much it costs for data retention, and what the standard periods are. Essentially, you want to calculate the total cost of ownership (TCO) for your tool, which will include the setup, training, maintenance, and staff costs associated with managing the tool(s).
How a Managed Service Provider Can Help With Observability and Monitoring
Building the reliability of your IT infrastructure can help you make smarter future decisions and promote stronger performance and optimization. However, choosing a tool or knowing which metrics to track can feel like a lot to take on. A managed service provider, like TierPoint, can offer guidance, pointing you in the right direction and helping you cultivate your observability and monitoring processes. Explore our advisory and consulting services today.

Table of Contents
